AI product analytics for reliable data insights: SimplyPut

Dig into AI-powered product analytics to empower your team with real-time insights. Uncover user behavior patterns from the first click to power user status, helping you optimize your product and enhance user experience.

User Segmentation

Unlock deep insights into your user base with AI-powered segmentation. Analyze engagement metrics across different user groups, identify high-adoption industries, and understand your global user distribution to tailor your product strategy.

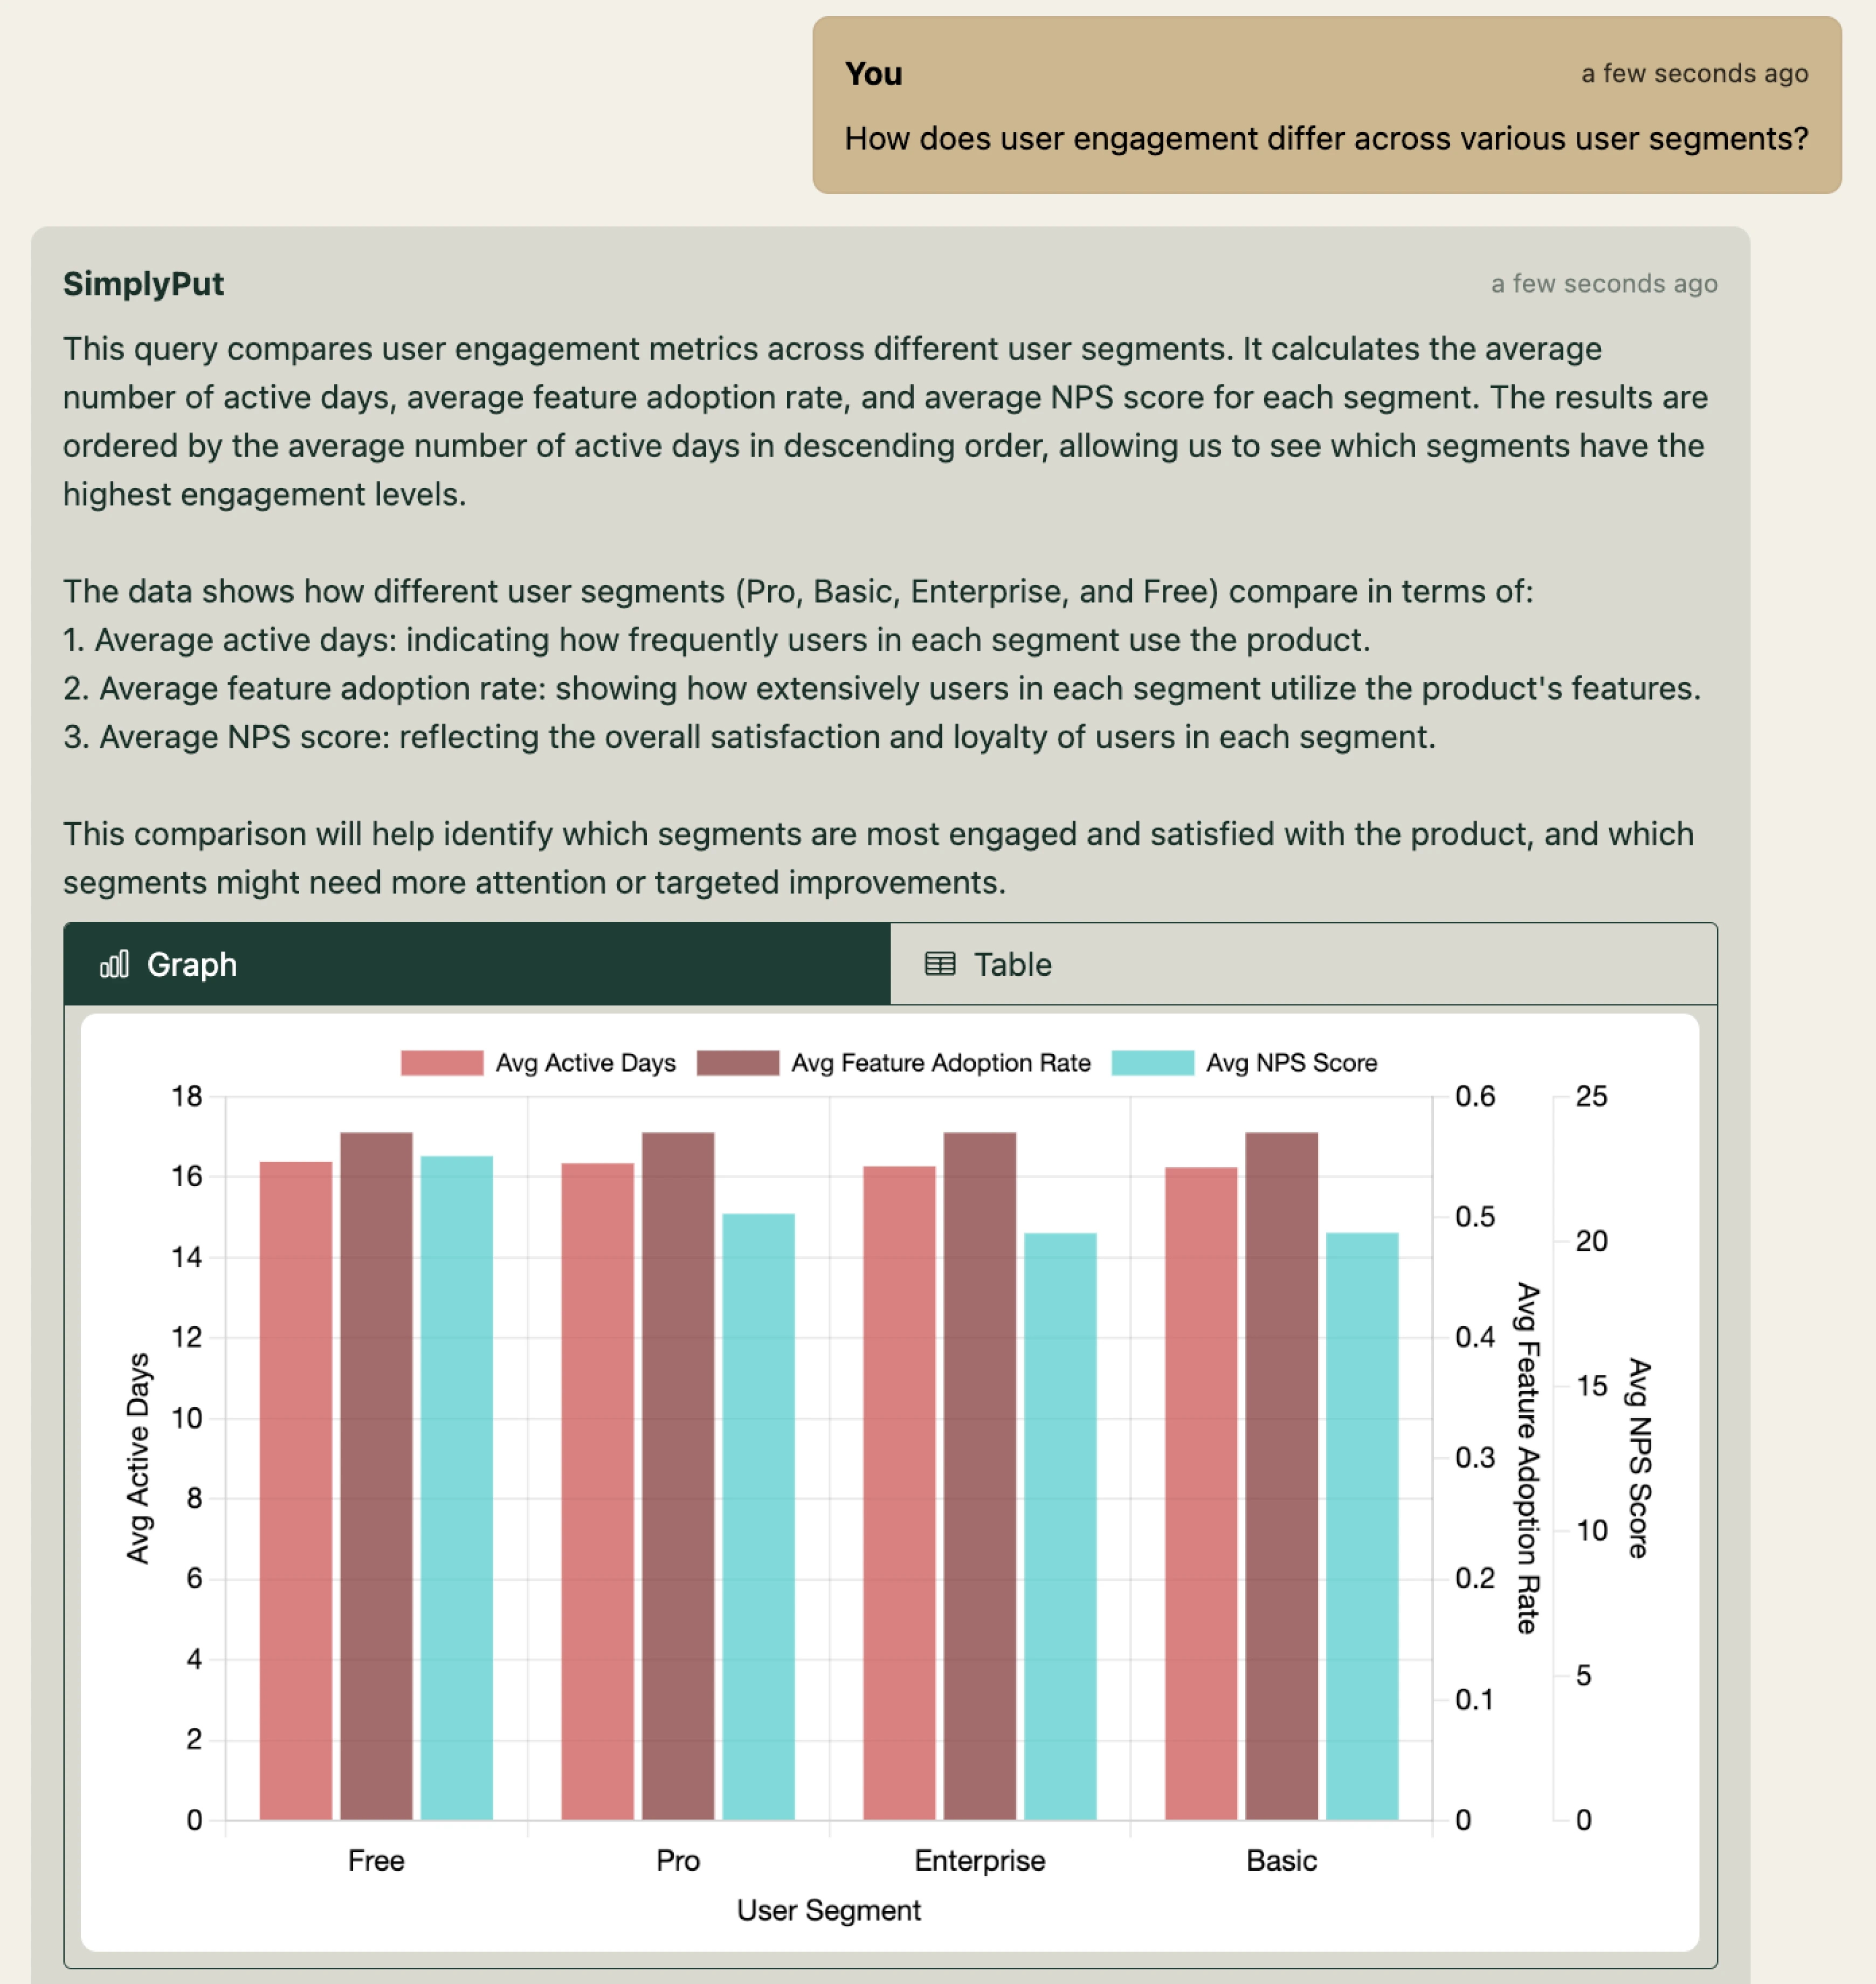
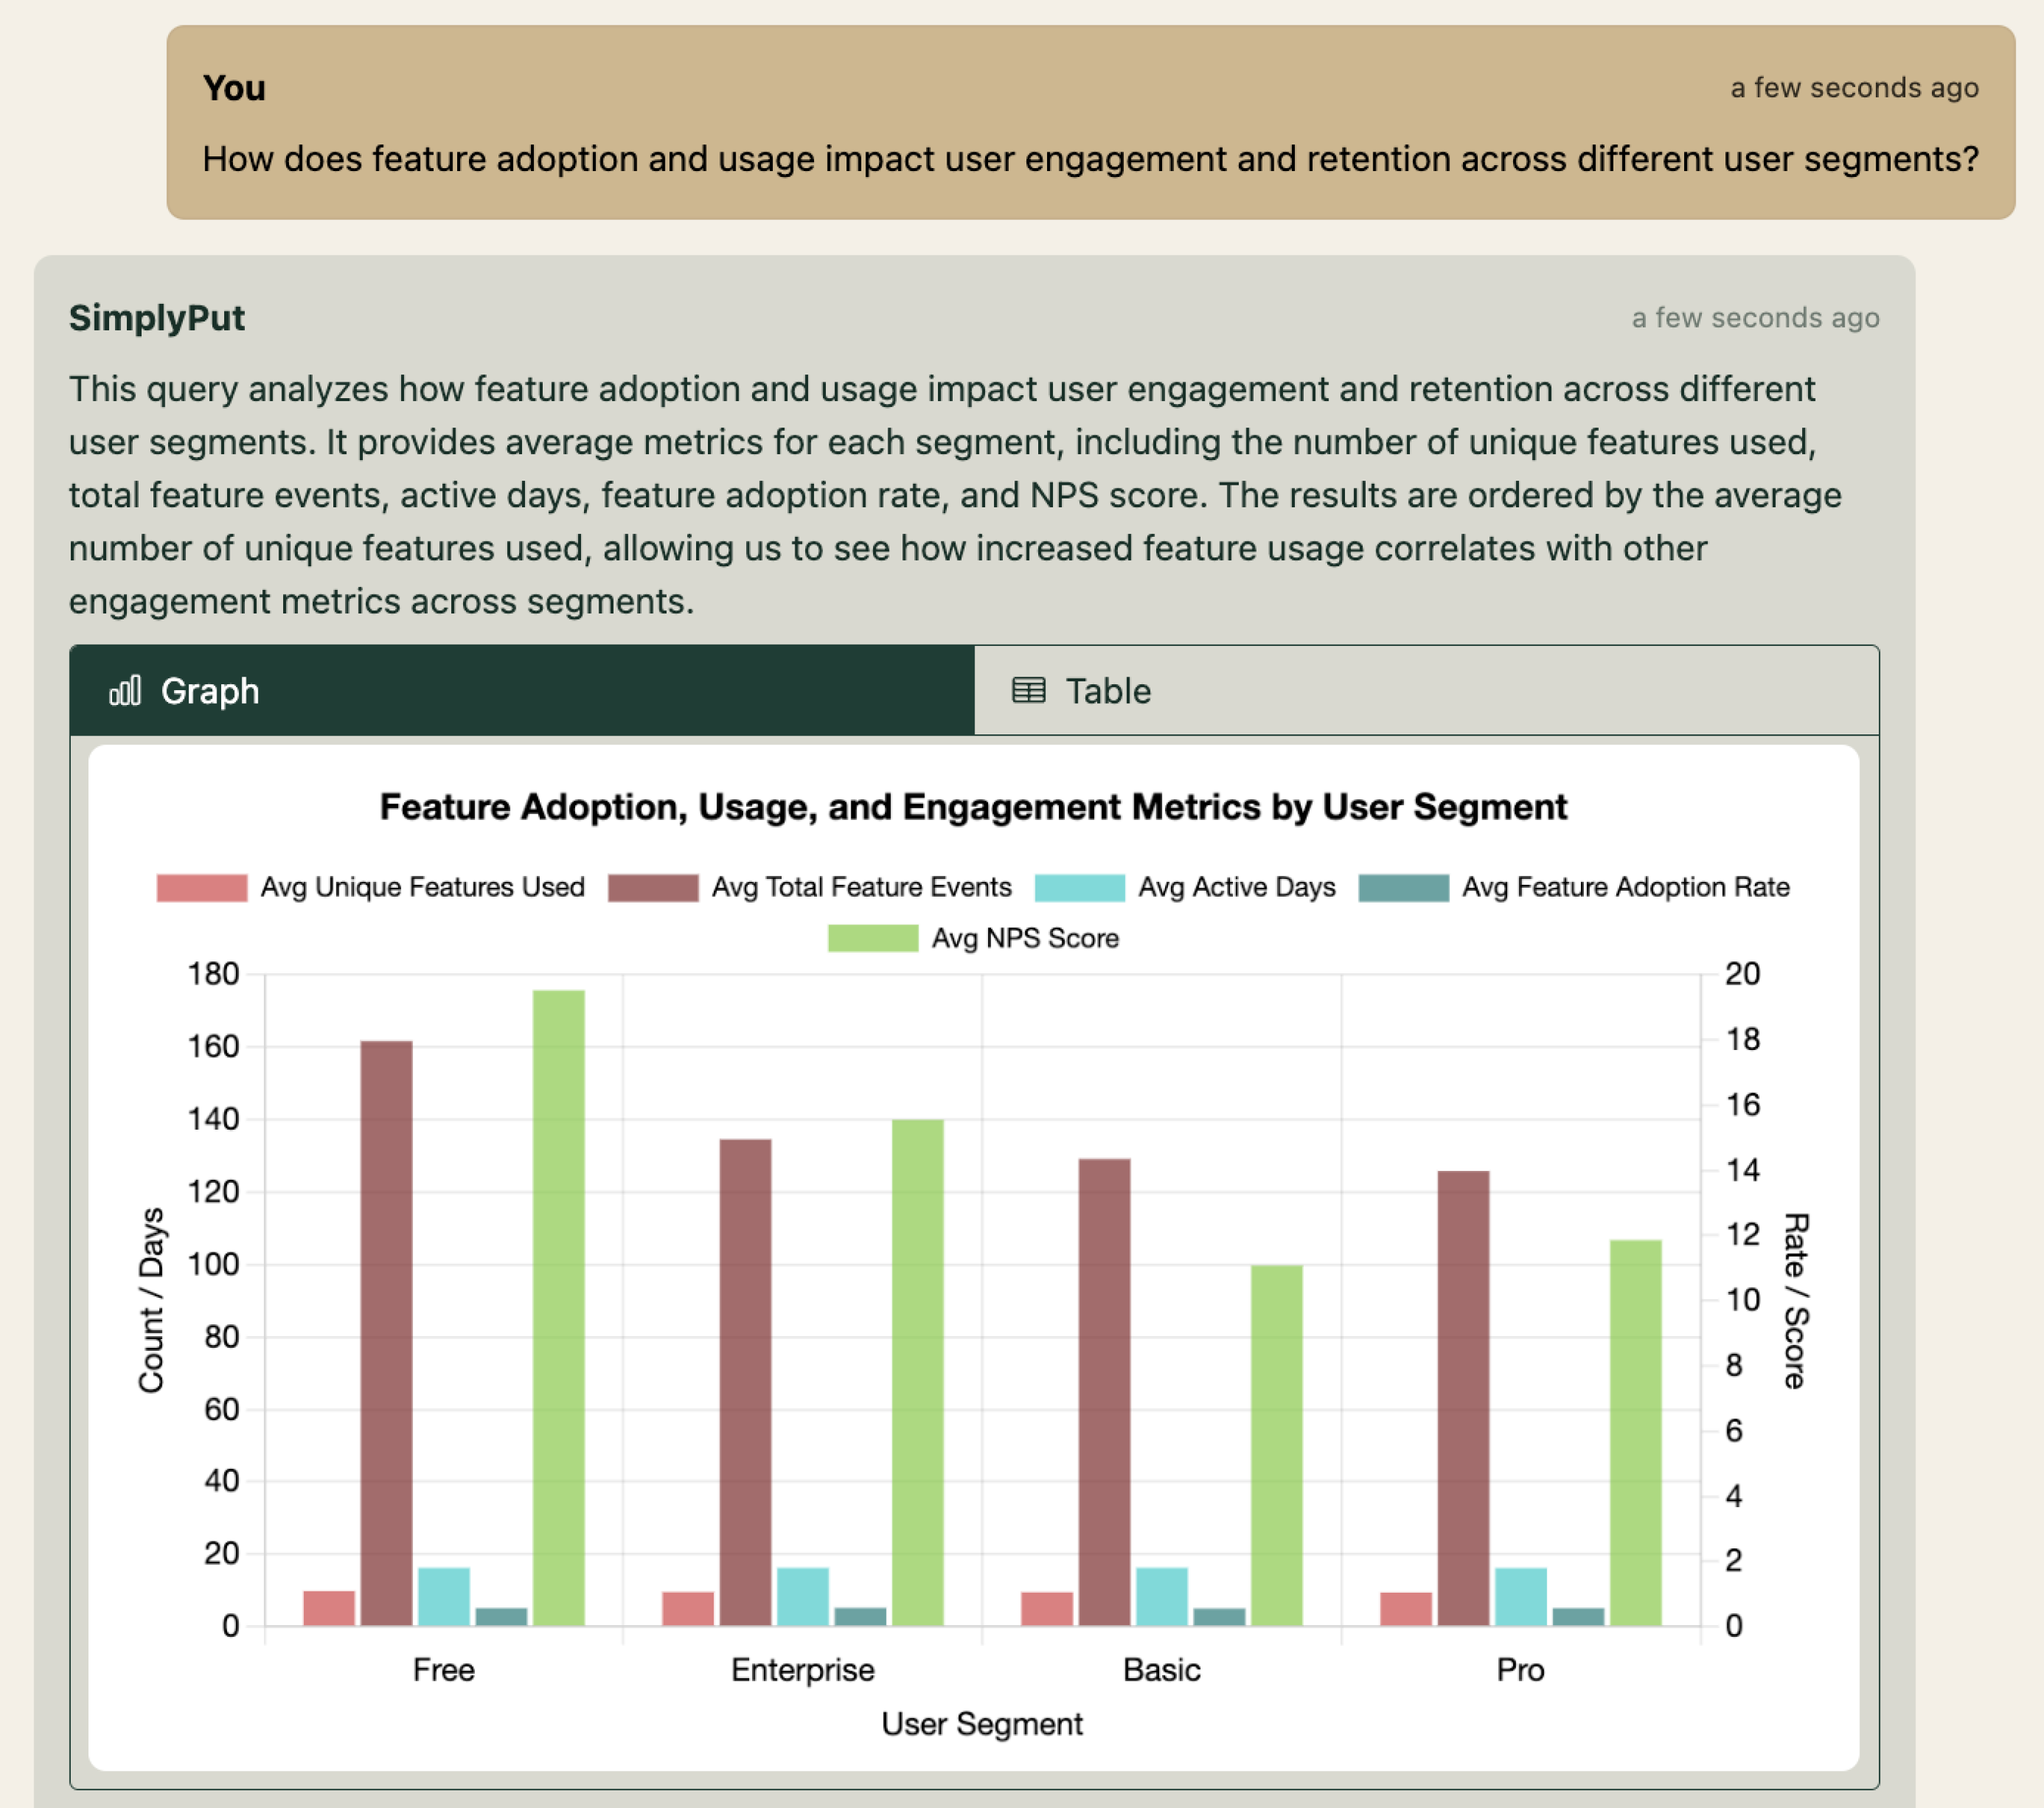
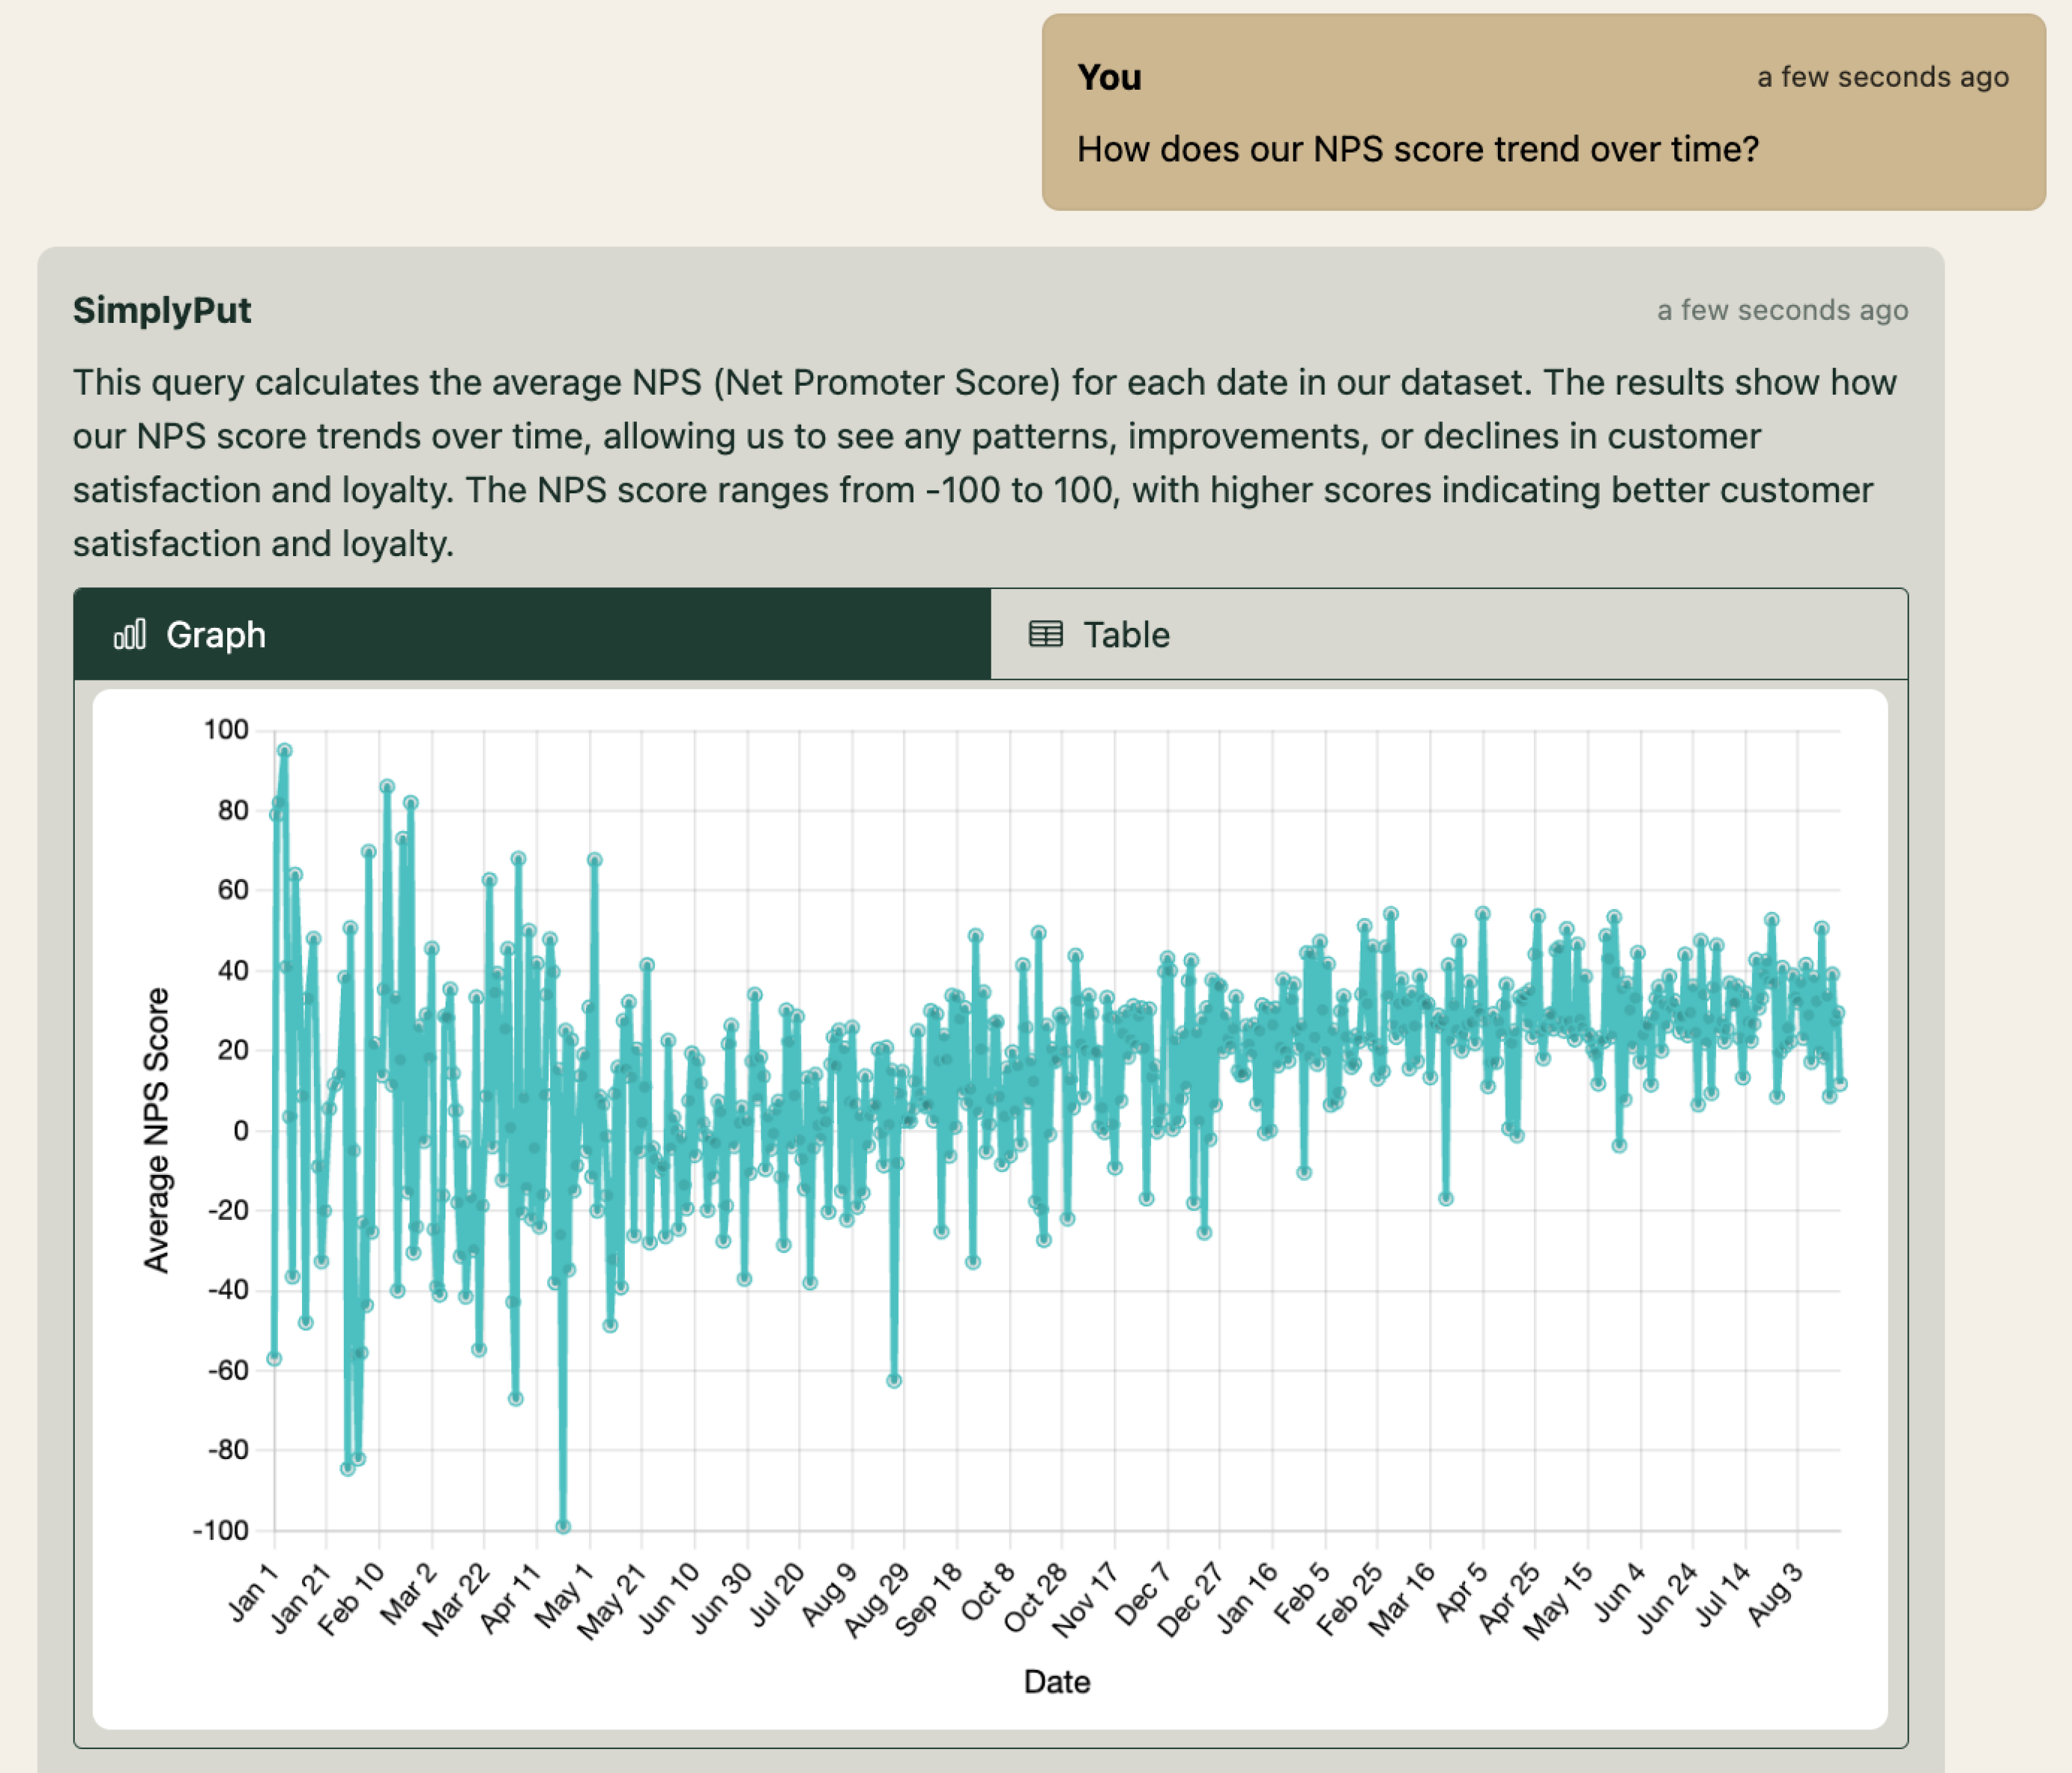
  • How do engagement metrics vary across different user segments?
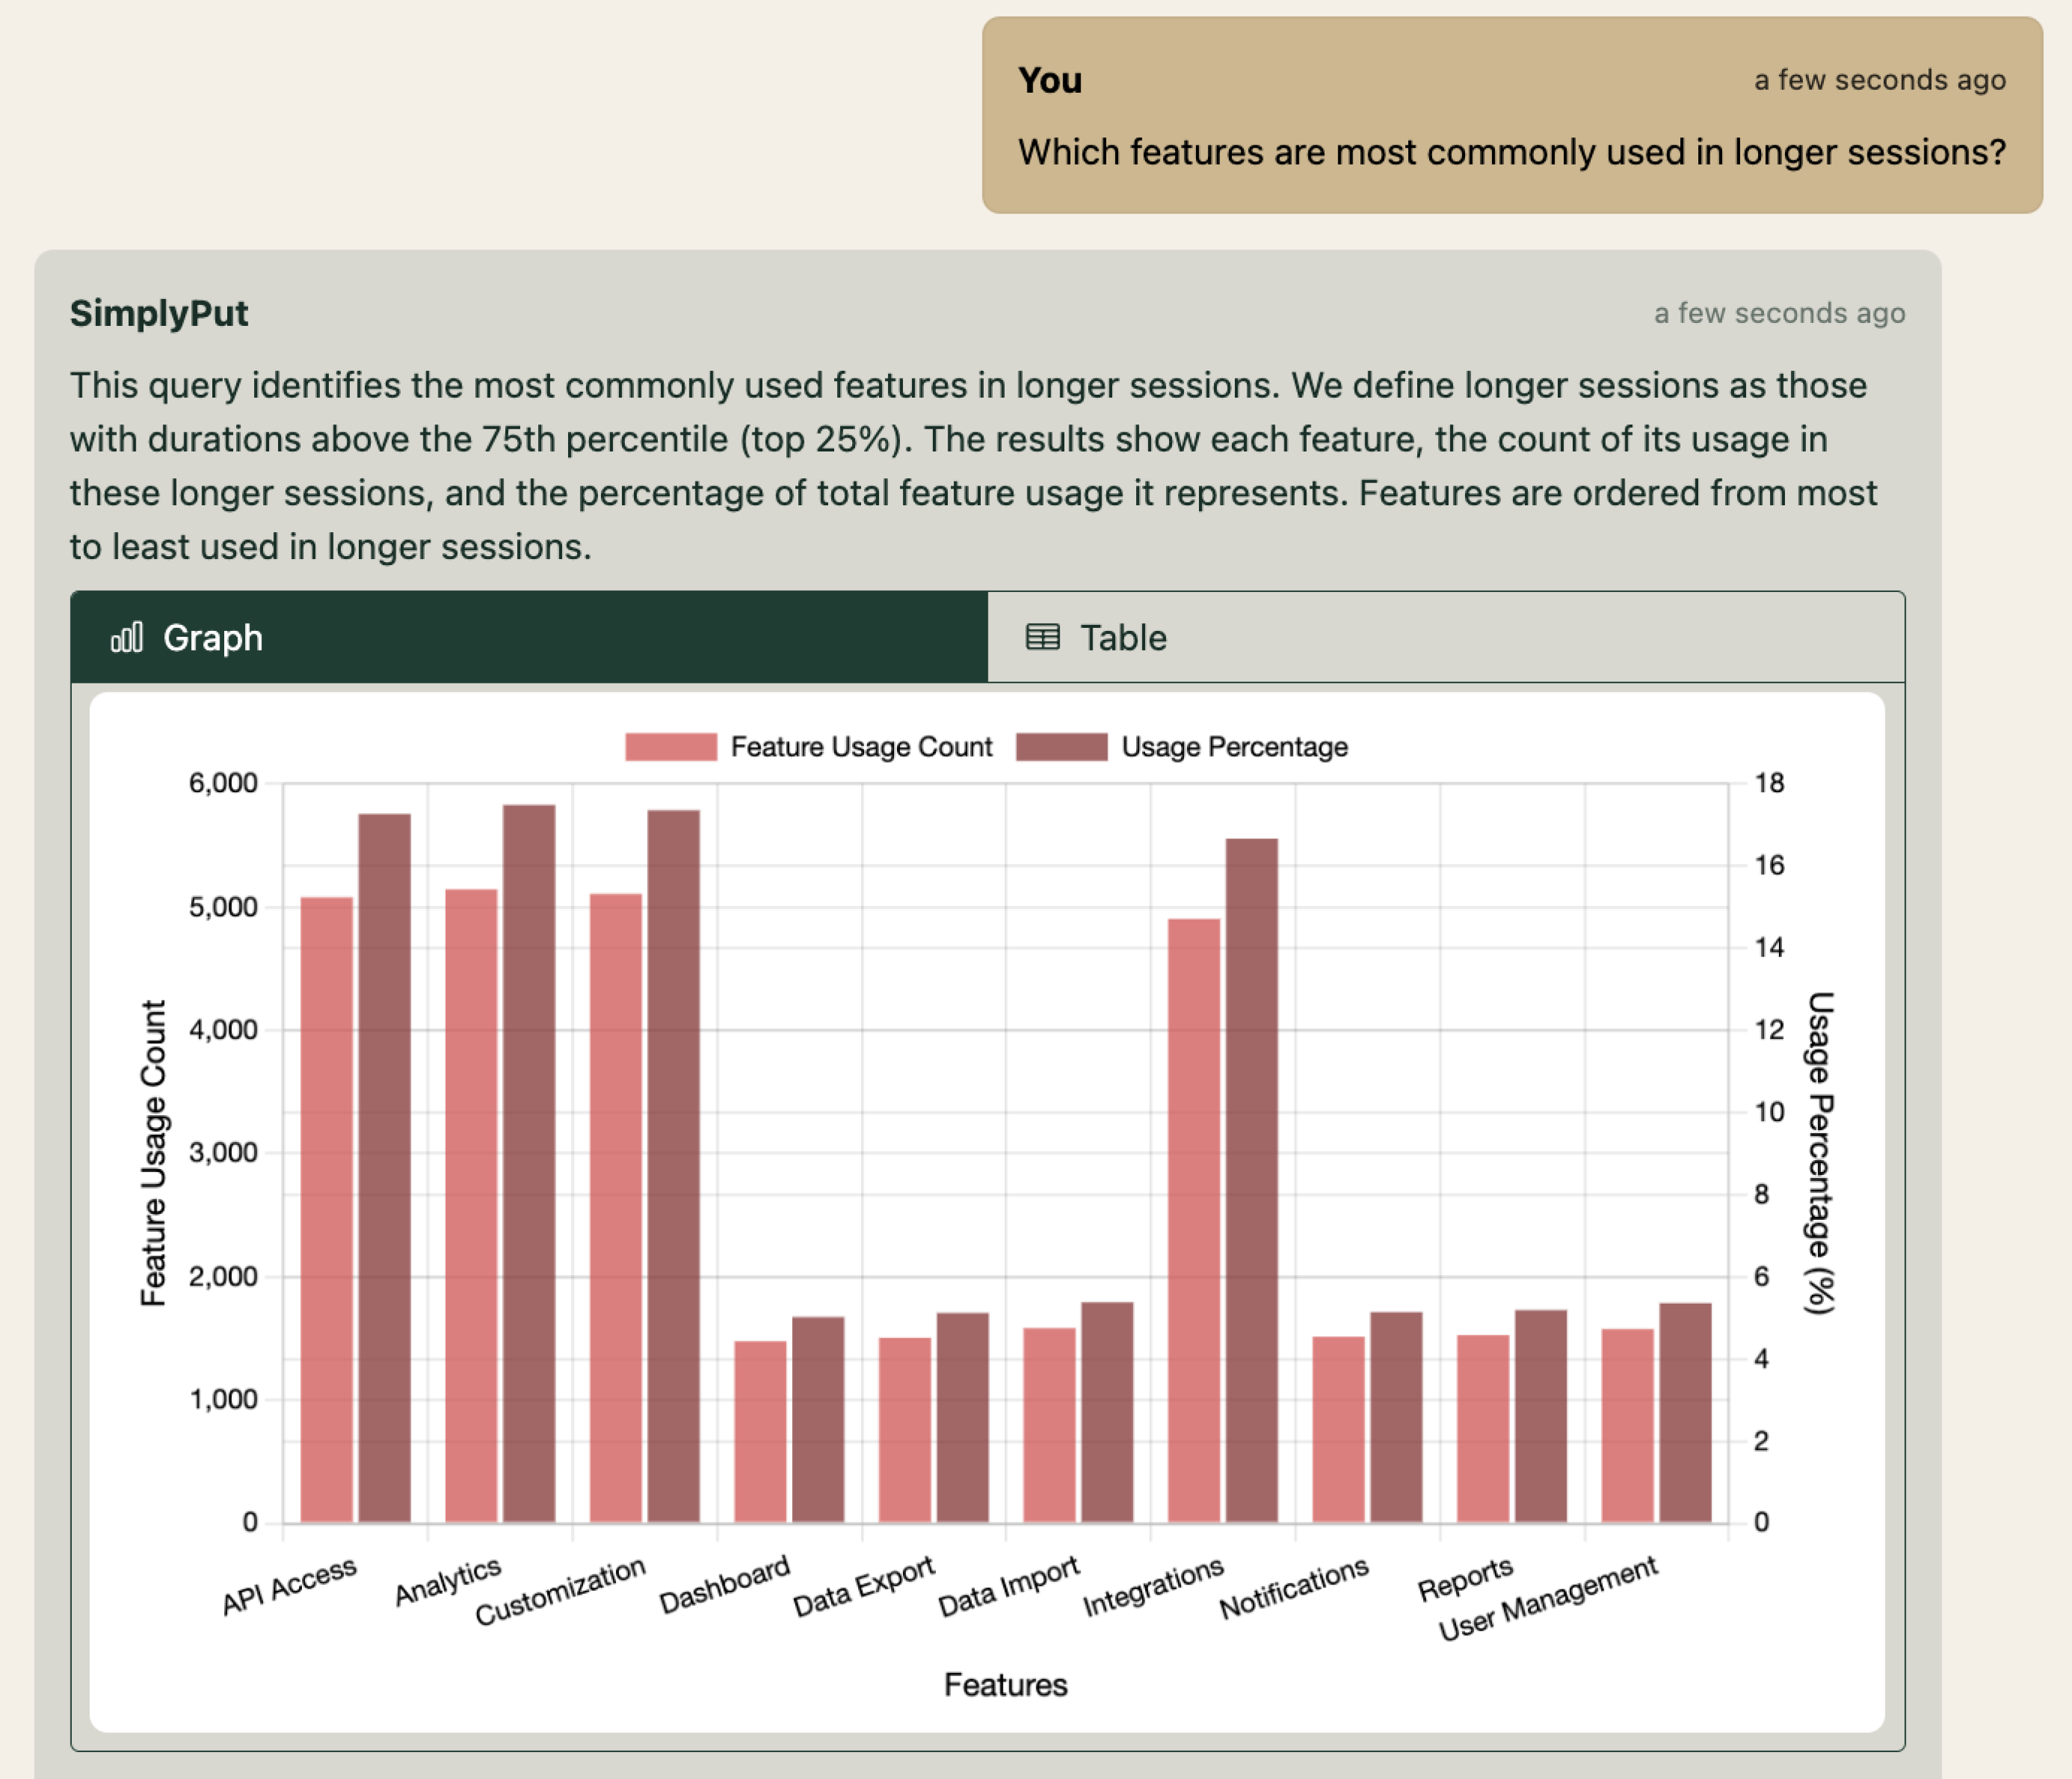
  • Which industries show the highest feature adoption rates?
  • What's the distribution of our user base across different countries?
User Segmentation Analytics Screenshot

Automated Product Reports

Stay informed with daily user activity summaries and monthly retention metrics delivered directly to your inbox and Slack through scheduled AI Reports. Keep a dynamic dashboard in SimplyPut that continually refreshes with the most up-to-date product analytics, insights, and trend analysis.

  • What is the average NPS score and its month-over-month change for each month?
  • What is the user retention rate over time?
  • Which features are most and least used in the last week?
Automated Product Reports Analytics Screenshot

Feature Adoption

Maximize feature adoption with data-driven insights. Identify your most popular features, understand the correlation between feature usage and user retention, and map out typical user journeys to optimize your product development roadmap.

  • Which features have the highest adoption rates?
  • How does feature usage correlate with user retention?
  • What's the typical user journey in adopting our core features?
Feature Adoption Analytics Screenshot

User Engagement

Boost user engagement with real-time analytics. Track active user metrics, analyze session duration impacts, and identify power user behaviors to drive product improvements and increase overall user satisfaction.

  • What's the average number of active days per user per month?
  • How does session duration correlate with feature usage?
  • Which actions are most commonly performed by our power users?
User Engagement Analytics Screenshot

Customer Satisfaction

Elevate customer satisfaction with AI-driven NPS analysis. Monitor NPS trends, correlate high scores with feature usage, and understand the relationship between feature adoption and customer satisfaction to guide product enhancements.

  • How does our NPS score trend over time?
  • Which features are most used by users with high NPS scores?
  • Is there a correlation between feature adoption rate and NPS score?
Customer Satisfaction Analytics Screenshot

Session Analysis

Optimize user experiences with in-depth session analytics. Compare session durations across devices, understand the impact of page views on feature adoption, and identify key features driving longer engagement to enhance your product's stickiness.

  • What's the average session duration across different devices?
  • How does the number of pages viewed impact feature adoption?
  • Which features are most commonly used in longer sessions?
Session Analysis Analytics Screenshot

Get started Ask your own questions of this data with our interactive demo