SimplyPut's Comprehensive AI Data Analytics

From period-over-period comparisons to advanced cohort and trend analyses, SimplyPut empowers your business with data-driven insights. Unlock the full potential of your data and make informed decisions that drive growth and success.

Period over Period Analysis

Compare performance across different time periods to identify trends, growth patterns, and seasonal variations. Make data-informed decisions and optimize your business strategies.

  • Compare weekly sales for Q2 2024 vs Q2 2023
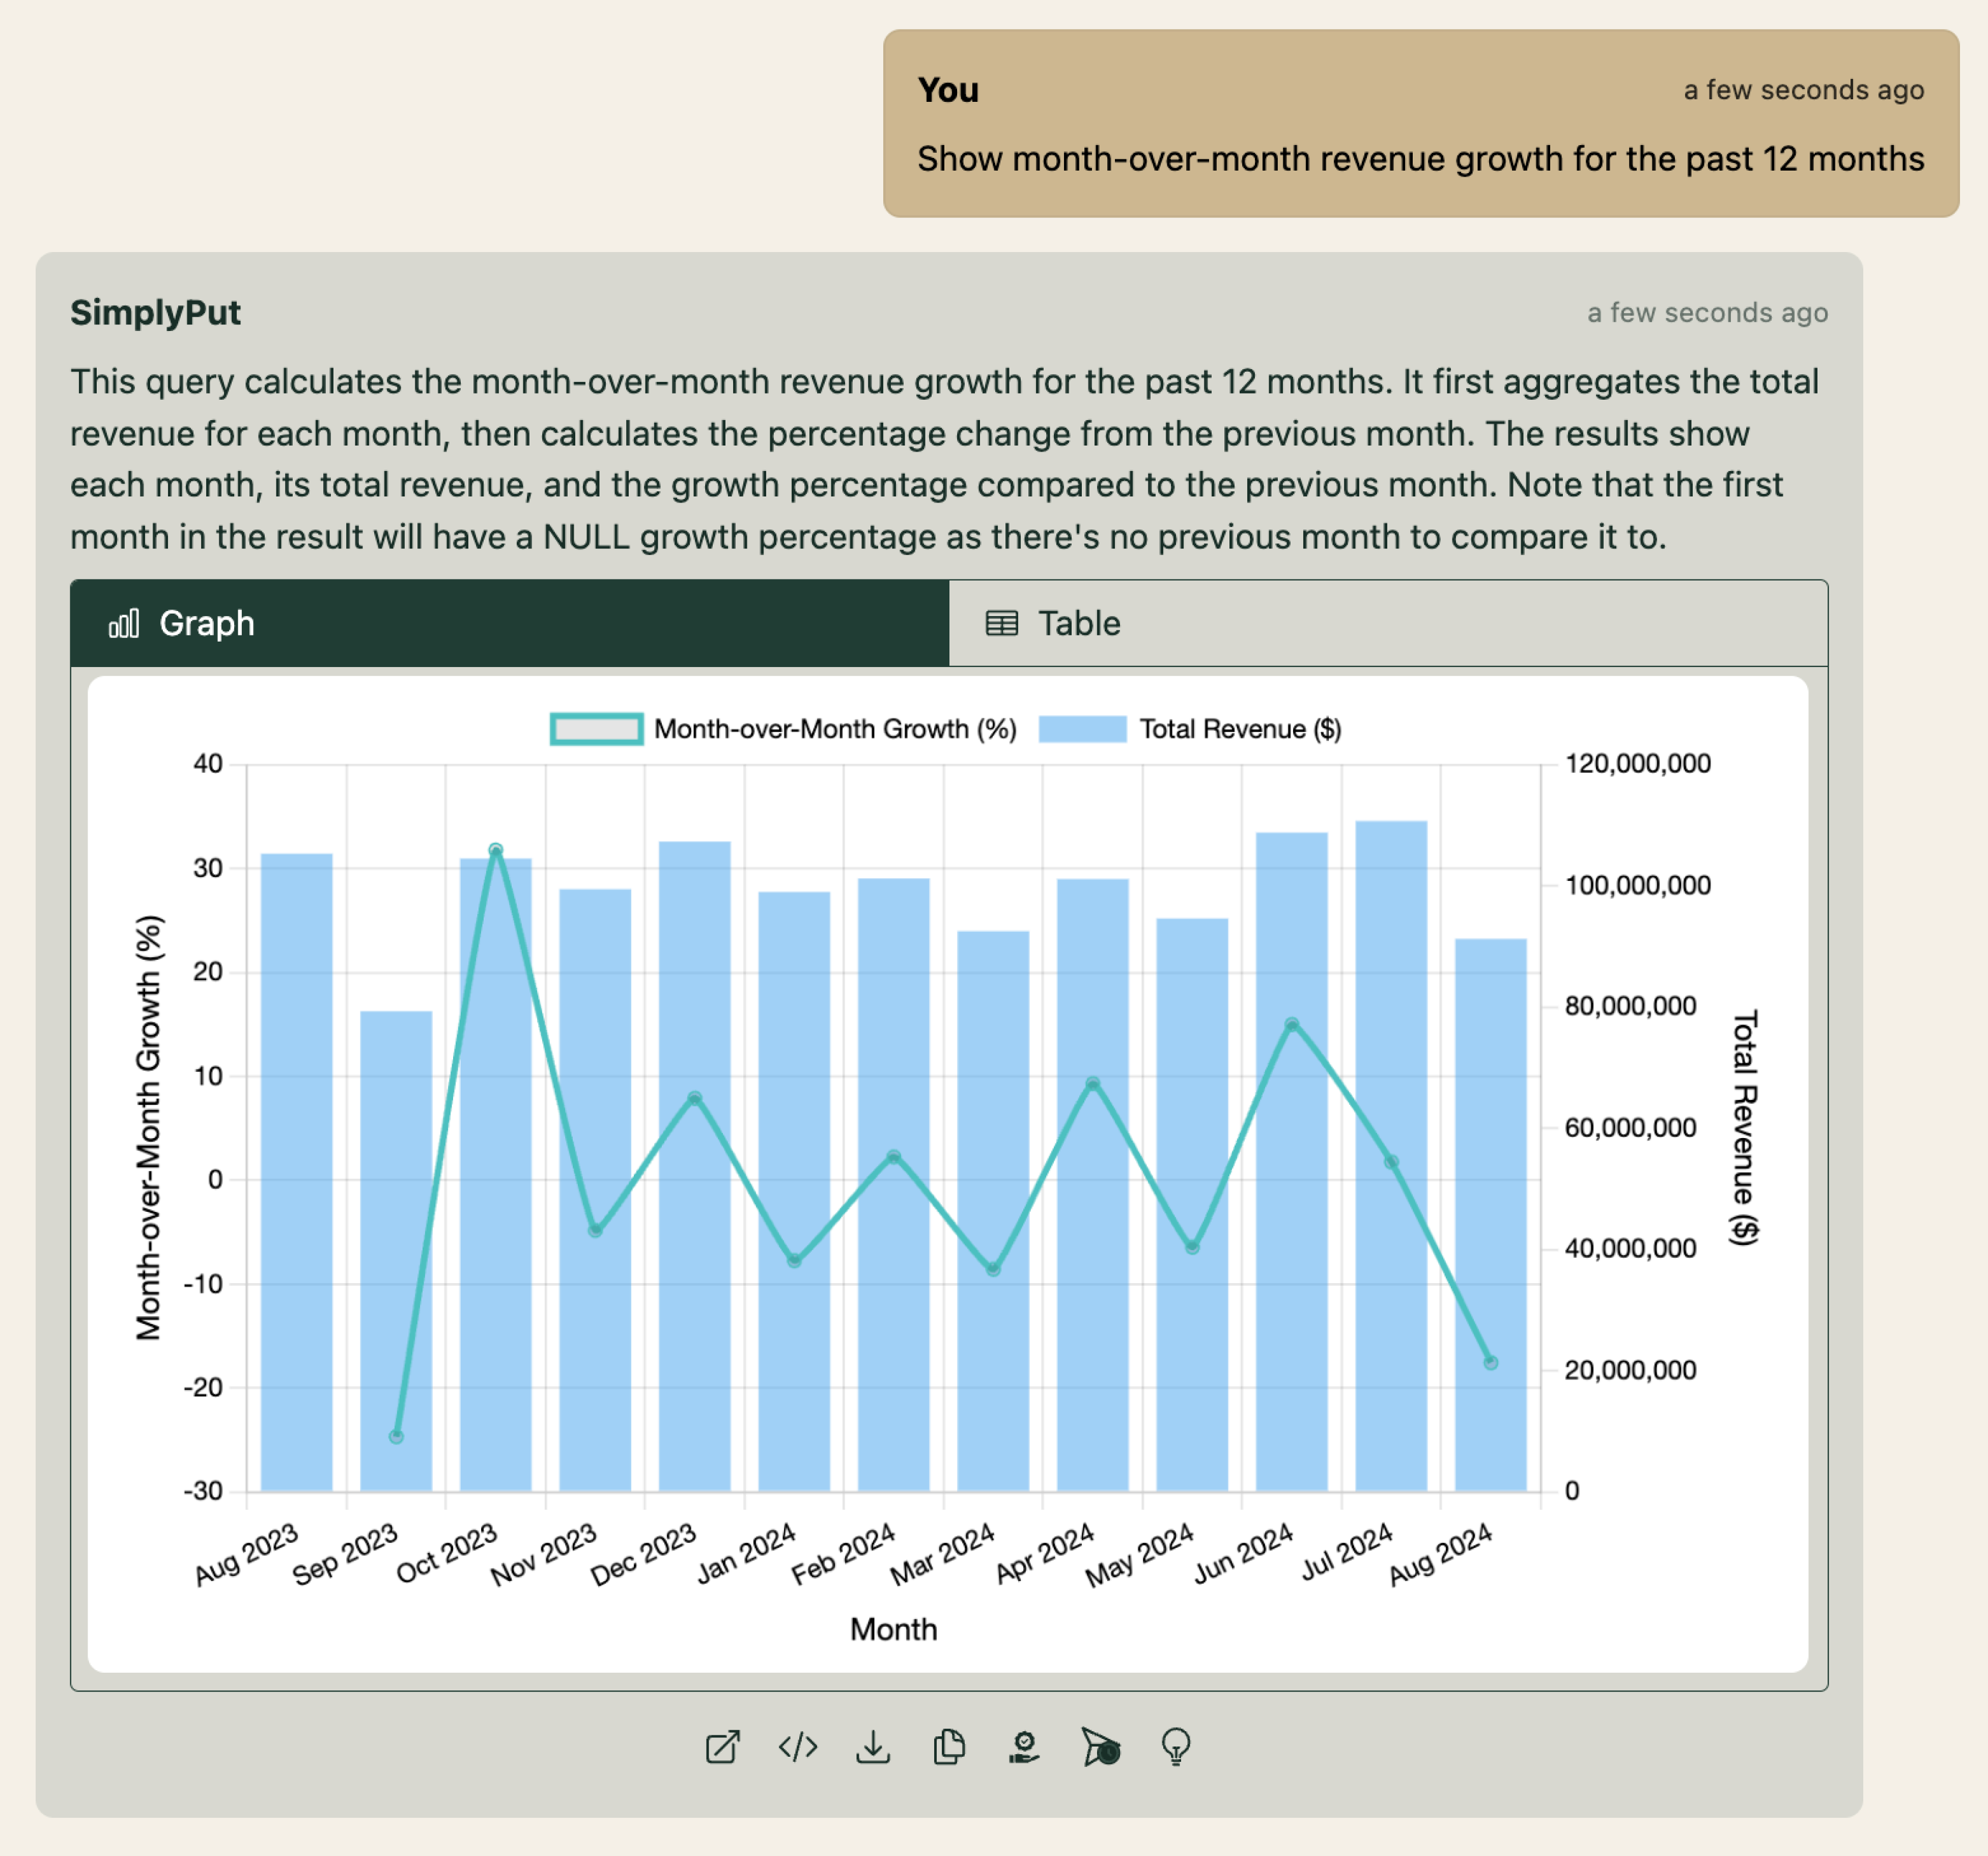
  • Show month-over-month revenue growth from August 2023 to July 2024
  • Compare the average daily sales for August 2024 vs August 2023
  • What's the year-over-year growth rate for each product category in Q2 2024 compared to Q2 2023?
Period over Period Analysis Analytics Screenshot

Cohort and Funnel Analysis

Gain deep insights into customer behavior over time and optimize your conversion process. Track cohort performance, identify key conversion points, and improve customer retention strategies.

  • Show me the retention rate of customers who signed up in 2023
  • What is the average revenue of customers who signed up in the first half of 2024
  • What is our website-to-purchase conversion rate for August 2024?
  • How do conversion rates differ across customer segments acquired in 2024?
Cohort and Funnel Analysis Analytics Screenshot

Trend Analysis

Identify long-term movements in your data and forecast future patterns. Enable proactive decision-making and strategic planning with advanced trend analysis.

  • Show me total revenue and its 7-day rolling average by day in Q2 2024
  • How has our average order value trended quarterly since Q1 2023?
  • What's the trend in customer satisfaction scores over the last 12 months?
Trend Analysis Analytics Screenshot

Customer Churn Analysis

Understand and reduce customer attrition. Identify at-risk segments, analyze churn factors, and develop data-backed retention strategies to improve customer loyalty.

  • What is our monthly customer churn rate for the past 6 months?
  • Which customer segments acquired in 2023 have the highest risk of churning?
  • What are the primary factors driving customer churn in Q2 2024?
Customer Churn Analysis Analytics Screenshot

Seasonality Analysis

Uncover seasonal trends to improve forecasting and planning. Optimize inventory management, marketing campaigns, and resource allocation based on data-driven seasonal insights.

  • What were our peak revenue months in 2023 and how do they compare to 2024 so far?
  • How does seasonality impact different product categories in Q3 compared to Q2 2024?
  • What seasonal patterns affected our inventory management in the first half of 2024?
Seasonality Analysis Analytics Screenshot

ROI Analysis

Maximize the effectiveness of your investments and marketing campaigns. Measure, compare, and optimize returns across various initiatives to drive business growth and efficiency.

  • What's the ROI of our Q2 2024 digital marketing campaigns compared to Q1 2024?
  • Which product lines have shown the highest ROI in the first half of 2024?
  • How does the ROI of our customer acquisition strategies vary by channel in 2024?
  • What's the projected ROI for our new product launch in Q4 2024 based on current data?
ROI Analysis Analytics Screenshot

Customer Lifetime Value Analysis

Calculate and analyze the long-term value of customers. Optimize acquisition and retention strategies based on data-driven LTV insights, focusing resources on high-value customer segments.

  • What's the average customer lifetime value for each subscription type?
  • How does customer lifetime value vary by acquisition channel?
  • What's the projected lifetime value of customers acquired in Q2 2024?
  • Which customer segments have the highest lifetime value?
Customer Lifetime Value Analysis Analytics Screenshot

Get started Ask your own questions of this data with our interactive demo